Part 1 - FSK eye diagram
Objectives
This part of the lab is a guide to measuring bit rates of real FSK signals. In it you will:
-
learn about GNU Radio Heirarchal blocks
-
use the flowgraph constructed during the past lab to demodulate an FSK signal and measure its bit rate
Part 1 Deliverables
- There are 3 questions in this part. They are clearly indicated.
- The question requires approximately 1 line of writing, and will generally address a concept. Answer the question and submit a single page containing the answers to your TA at the end of the lab.
Eye diagrams in GNU Radio
Compiling a QT GUI eye diagram heirarchal block
Download and open this grc file. Notice that instead of Variable blocks, there are Parameter blocks and the flowgraph is fed by a Pad Source block.
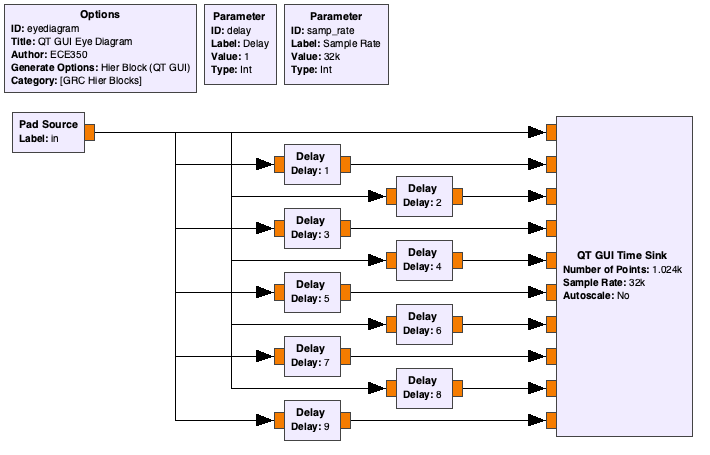
Flowgraph of the heirarchal eye diagram block
Try to execute this flowgraph. Nothing happens because this has been designed to be a Heirarchal block. Heirarchal blocks can be compiled into a block which becomes available for your other GRC flowgraphs.
Open the Options block and check that the Generate Options parameter is set to Hier Block (QT GUI).
- The Category parameter controls where it can be found in the GRC search panel. This means that when compiled, your block will be available in the category called “GRC Hier Blocks”.
Generate the flowgraph using the  button (the icon changes with operating system, you can also go Run->Generate in the menu bar), instead of executing it.
Open a new flowgraph, add a Signal Source of type Float and connect it to a Throttle block.
- Set the Waveform parameter to either “Cosine” or “Sine”.
Now look for your newly built heirarchal block. If it is not there, you can reload all of the blocks with the  (icon should be similar on different operating systems).
Add a QT GUI Range block to control the delay of the QT GUI Eye Diagram block.
- Set the Type to “Int”
- Give it a default value of 1, a minimum of 0 and a maximum of 50
- Call the variable
delay - Set the Delay parameter of the QT GUI Eye Diagram block using this variable
Also set the sample rate argument in the QT GUI Eye Diagram to samp_rate.
Execute the flowgraph, now change the delay using the QT GUI Range slider until a clear eye diagram is visible. Notice that the eye appears at multiples of this value. This value is the number of samples in a bit, so if you delay by 2 or 3 or more bits you will still see an eye diagram. Notice that in this case the eye diagram disappears when delayed by 2 bits. That is only because we are using a continuous wave! For a real data bitstream the delayed version will never “percetly line up” like this.
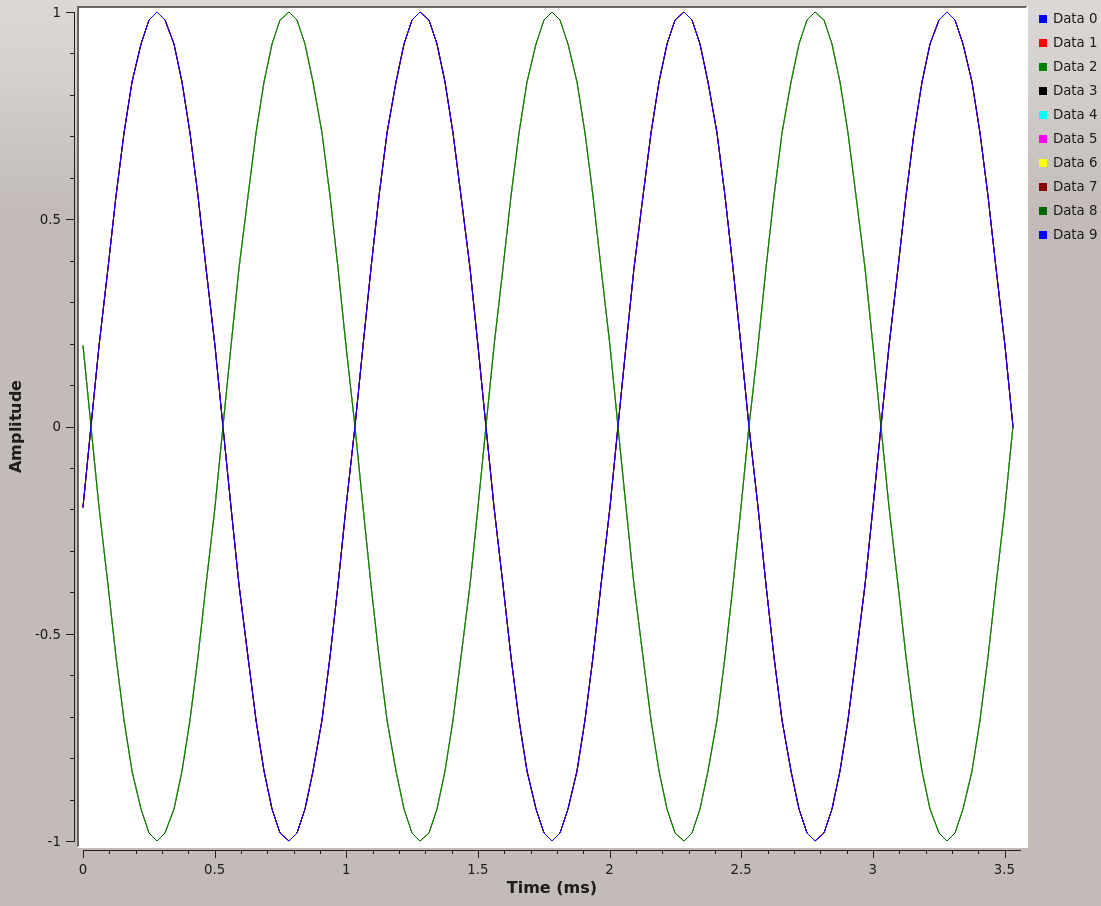
Eye diagram for a 1 kHz sine wave
You can click on the data labels (“Data 0”, “Data 1”, etc) to enable and disable different streams. Remember that each stream is just a delayed version of the input. As you disable streams you will see the redundancy in some of them.
Because this is a sine wave with a bit message of 101010..., you will get a perfect eye diagram with only two streams (one delayed).
Deliverable Question 1
At what sample delay does this occur and how does this delay relate to the sampling rate?
Deliverable Question 2
What is the bitrate of this source? How does this relate to the message frequency?
This flowgraph is not a deliverable.
Be careful
This lab section is possible to do at UVic in the Communications/SDR lab (A309) using an Ettus USRP and also remotely using an RTL-SDR. If you are unsure which to complete talk to your TA. Make sure to pick the right tab below (between USRP and RTL-SDR) so that you don’t complete the wrong lab instructions.
A real-time USRP-received FSK signal
-
Download and open this GRC file. It is very similar to the one you built in the last lab.
- Add a QT GUI Eye Diagram block.
- Use the included
delayvariable for the block’s delay parameter - It should look like the following figure
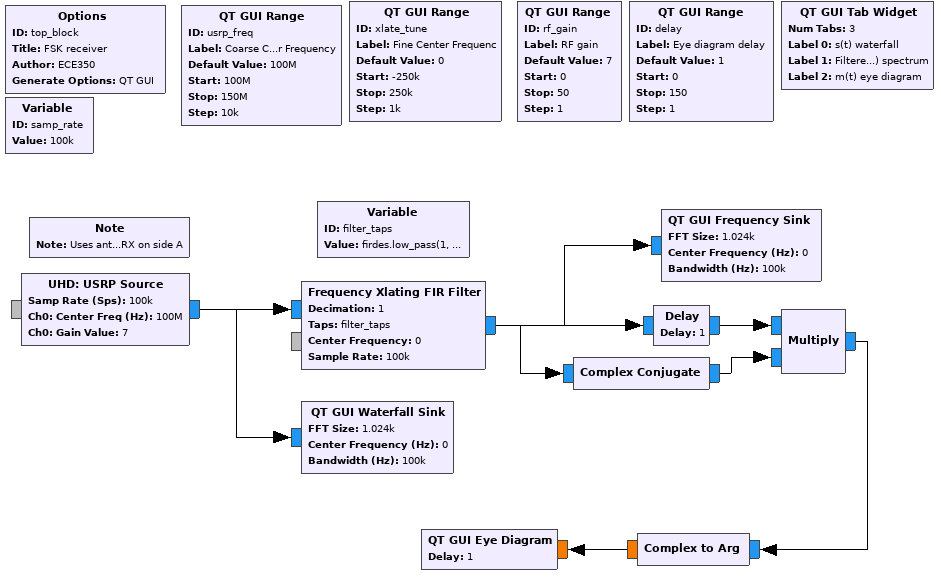
GRC file of FSK demodulation being fed into a user-controlled eye diagram - Use the included
-
Execute the flowgraph and tune to the 2-level FSK signal at 142.17 MHz. This signal is the control channel for the CREST public safety radio system.
The bandwidth of this signal is about 25 kHz compared to the 200 kHz for FM broadcast signals.
- In the waterfall plot, the CREST signal should be fairly strong as in the figure below.
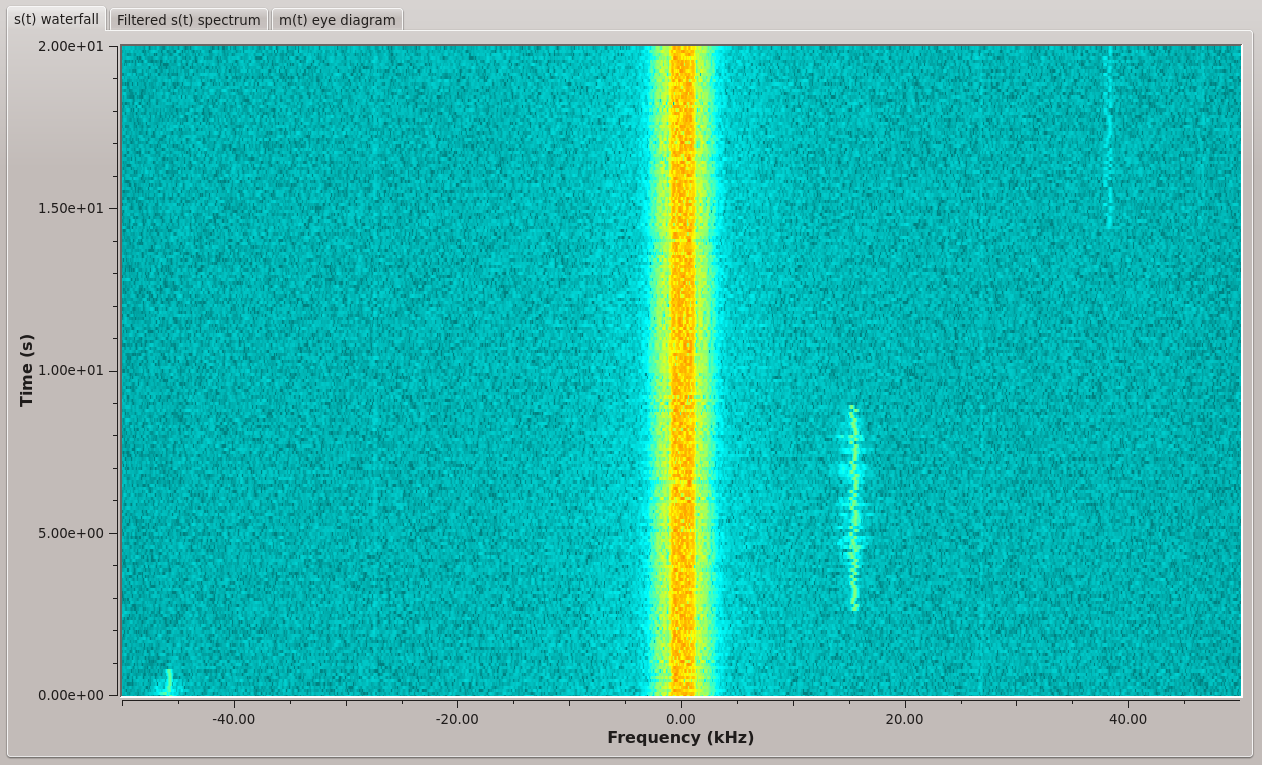
Waterfall of CREST FSK - Now go to the eye diagram and set the delay to 0. It should look like the following figure.
- By setting the delay to 0, you have perfectly overlapped all 10 streams.
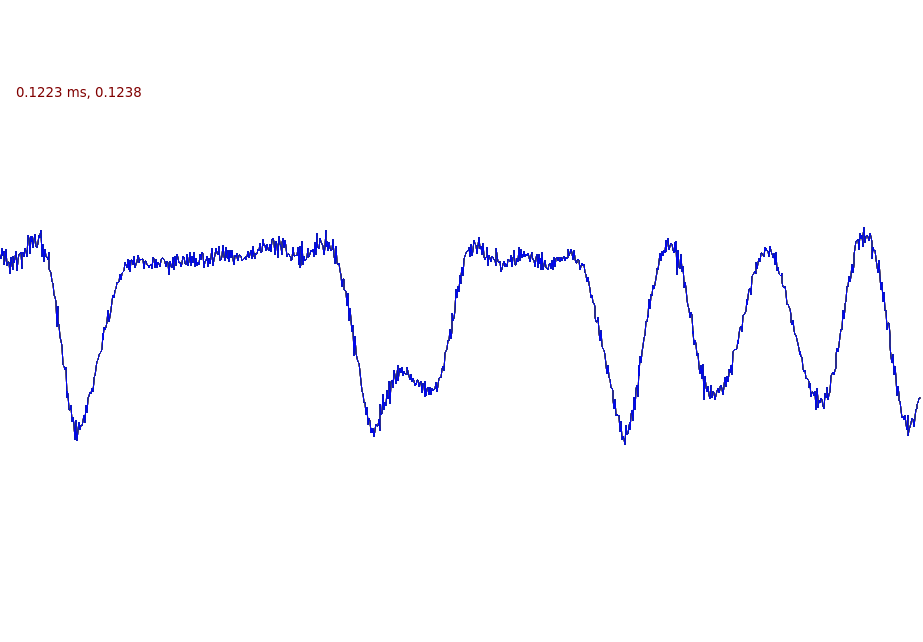
Demodulated CREST FSK -
Now change the delay until the eye diagram becomes clear. It may help to increase the RF Gain parameter.
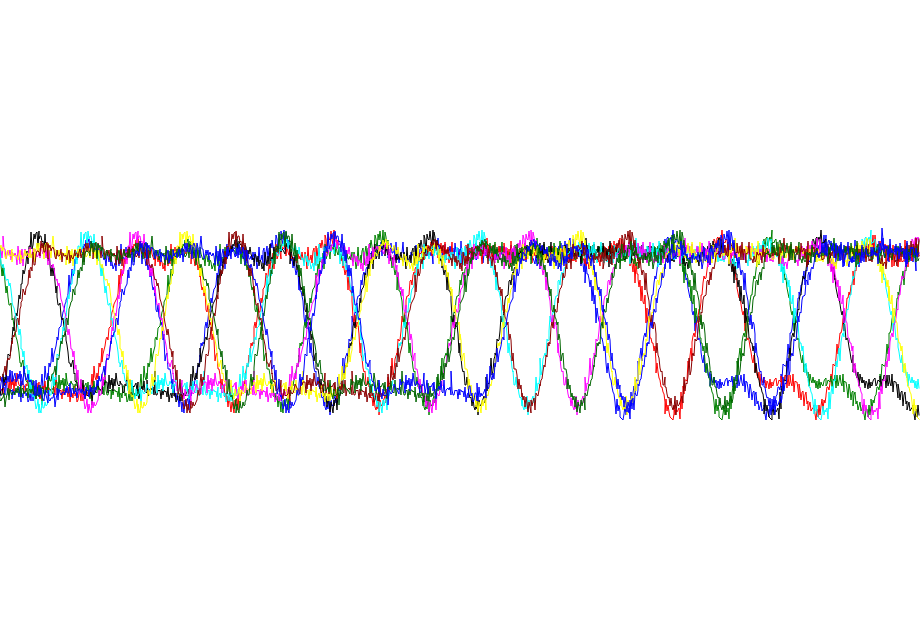
Eye diagram of CREST FSK signal
Deliverable Question 3
What is the bit rate of the control channel for the CREST public safety radio system in bits-per-second? Hint: look at the time between the symbols.
A real-time RTL-SDR-received FSK signal
Download and open this GRC file. It is very similar to the one you built in the last lab.
Open the QT GUI Eye Diagram block.
- Use the included
delayvariable for the block’s delay parameter - Set the Sample Rate parameter of the QT GUI Eye Diagram to the variable
samp_rate. -
It should look like the following figure
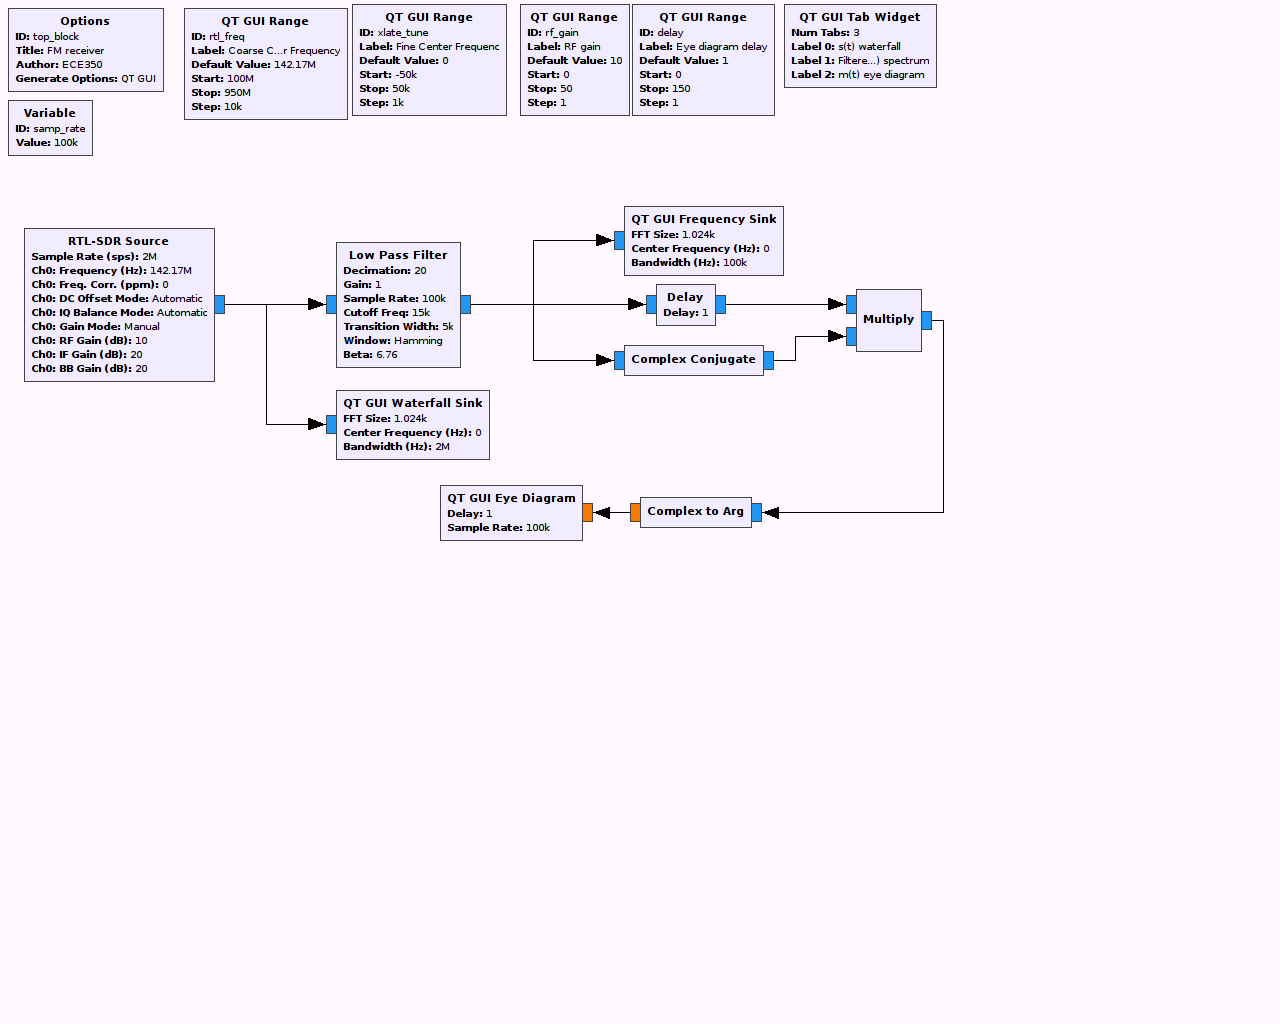
GRC file of FSK demodulation being fed into a user-controlled eye diagram
For this section of the lab you will need to find a strong paging or FSK signal near you. A good reference for finding a signal is RadioReference. If you are near Victoria, there are several near 142 MHz and a very strong (but intermittent) one at ~929.22 MHz. It is often easiest to find a signal using CubicSDR which has a built in FM demodulator so you can check how many levels the FSK is (top right of the figure below). If you are still unable to find a suitable signal contact your lab TA.
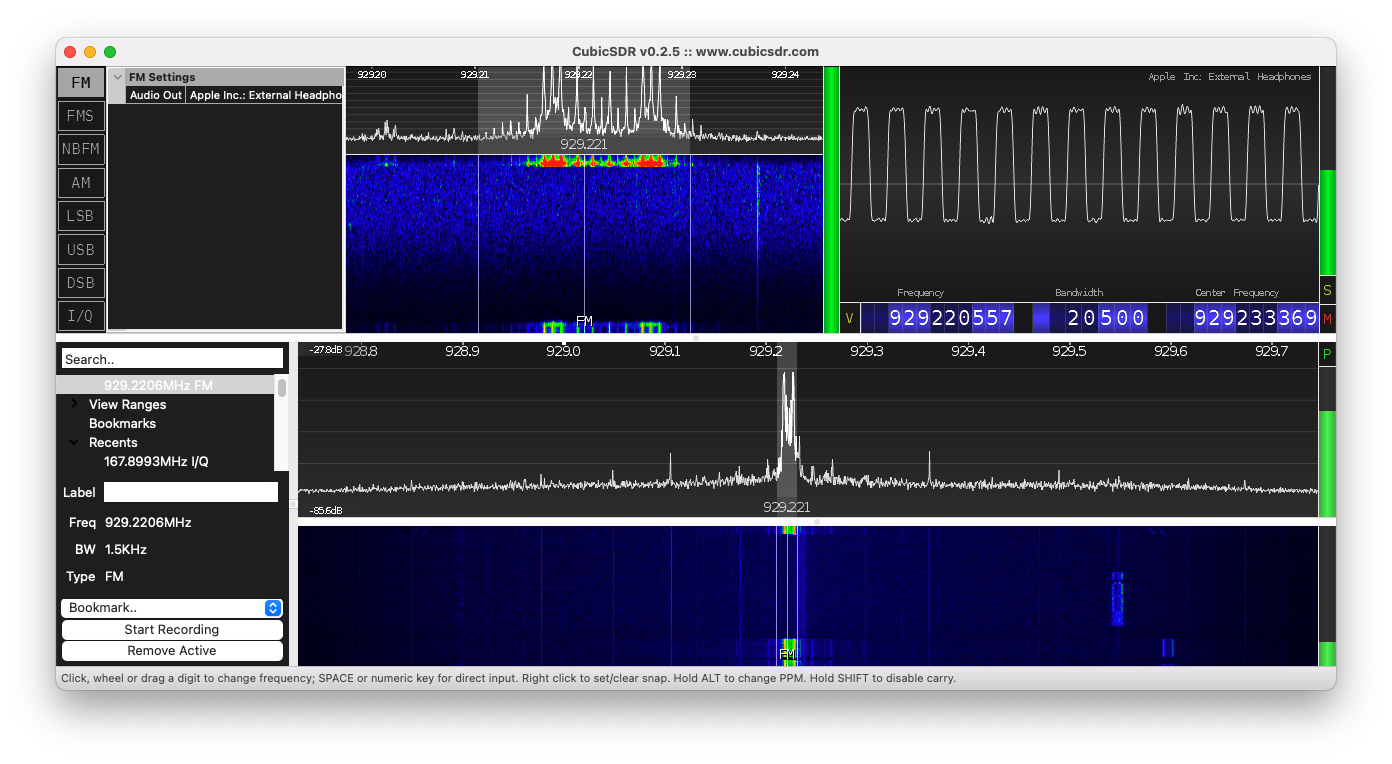
CubicSDR showing the very strong two level CREST FSK signal at 929.22 MHz (near Victoria, BC)
Execute the flowgraph and tune to your chosen 2-level FSK signal.
Note
You may need to set the device argument to rtl=0. Try with and without and see what works on your system! Also, make sure that CubicSDR is closed while you’re trying to run this flowgraph - otherwise GNU Radio can’t access the radio.
Check the bandwidth of the signal. You may need to adjust the filter parameters accordingly. The filter defaults to expecting a 25 kHz tone separation.
In the waterfall plot, the FSK signal will hopefully be fairly strong as in the figure below.

Waterfall of FSK
Now go to the eye diagram and set the delay to 0. It should look similar to the following figure. By setting the delay to 0, you have perfectly overlapped all 10 streams.

Demodulated FSK
Now change the delay until the eye diagram becomes clear. It may help to increase the RF Gain parameter.

Eye diagram of FSK signal
If you are unable to get a clear enough eye diagram to measure the bit rate, you may use this file of demodulated FLEX 2-level paging. To use it you can check what the sample rate is (most OS’s will show you in the file explorer/browser). Because it is already demodulated you just need a WAV Source block with the appropriate number of channels, a Throttle block and a QT Eye Diagram block.
Deliverable Question 3
What is the bit rate of the control channel for the FSK signal in bits-per-second? Hint: look at the time between the symbols.
Take a screenshot of the eye diagram and attach it to your submission so the TA can confirm your bit-rate.
Deliverables
From this lab part, keep the following for later submission to your TA:
- The answers to three deliverable questions.
UVic ECE Communications Labs
Lab manuals for ECE 350 and 450