Part 6 - Calculating BER
Objectives
You will use the values recorded to plot a \(BER-\frac{E_b}{N_0}\) curve for each of the noncoherent and coherent simulations and then compare them with theory.
Part 6 deliverables
For this section, the deliverables are:
- the answer to two deliverable questions,
- the code used to generate the BER curve (with the dataset hard coded into it),
- the resulting BER curve as a .PNG image file.
Generating a BER curve
Using the values collected throughout this lab you can now generate some \(BER-\frac{E_b}{N_0}\) curve.
You can use a programming language of your choice, but python or matlab have some handy tools for this job built in.
Plot five curves on the same axes:
- BER curve for the theoretical coherent BPSK,
- BER curve for the simulated coherent BPSK,
- BER curve for the theoretical noncoherent DPSK,
- BER curve for the first simulated noncoherent DPSK.
- BER curve for the second simulated noncoherent DPSK.
Theory curves
For generating the curves of the theoretical \(BER-\frac{E_b}{N_0}\) review the theory section of this lab. For the Q-function, Matlab ships with qfunc() while python has norm.sf() included in the scipy package.
Simulation curves
You collected datasets of BER values for Eb/N0 values of 0, 2, 4, 6, 8 dB. Plot them against each other (remembering that \(BER=10^{-X}\)).
Plotting details
Now that you have the five curves, ensure that the plot has:
- a log scale on the y-axis
- a linear scale on the x-axis
- appropriate axes titles
- a legend (one entry for each of: “Coherent theory”, “Coherent simulation”, “Noncoherent theory”, “Noncoherent simulation 1”, “Noncoherent simulation 2”)
A sample of what the plot might look like is included below (with all the labelling elements removed).
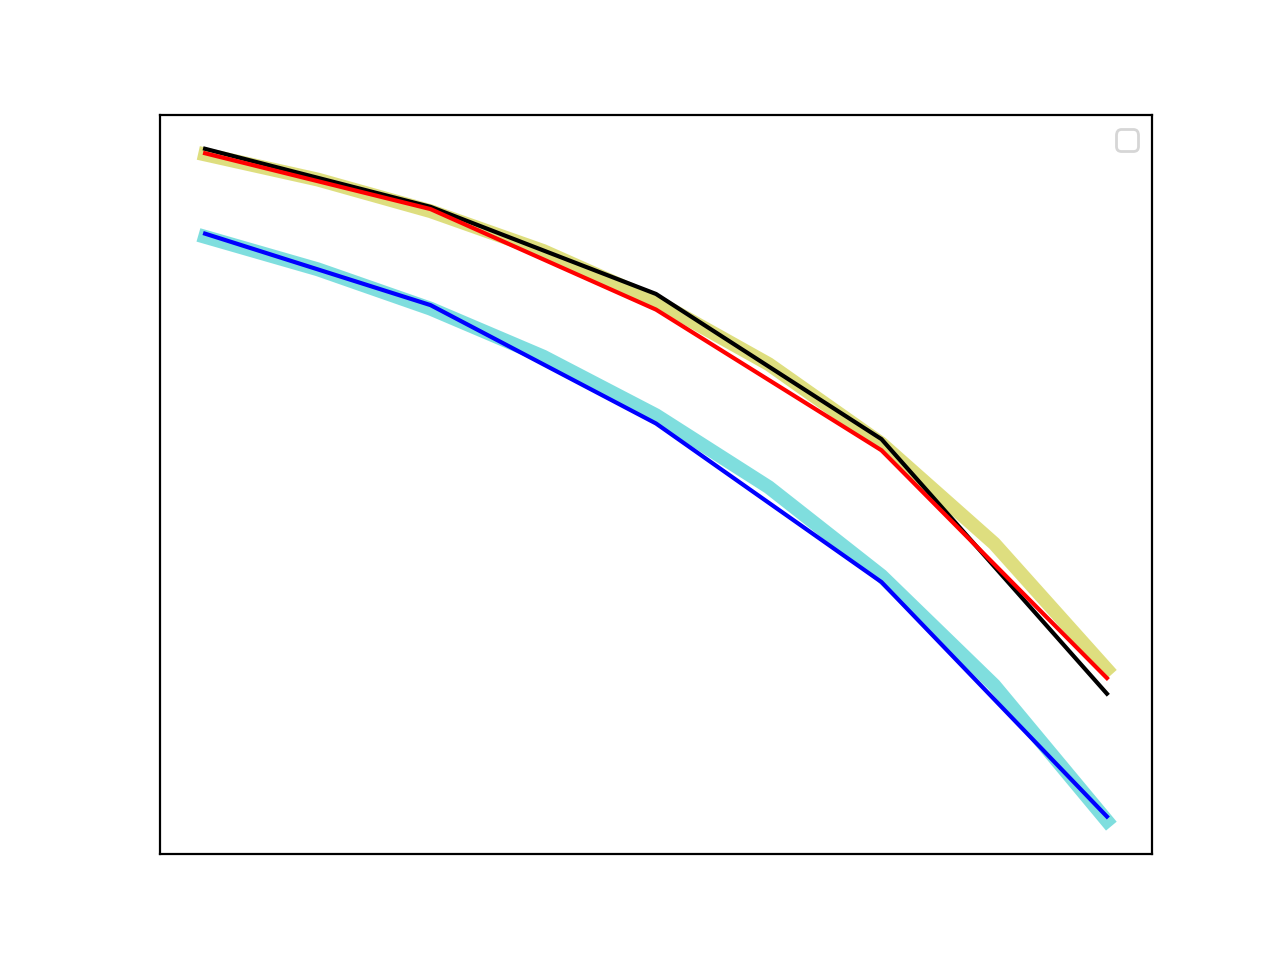
Sample BER curve.
Deliverable question 6
Provide insight into your results. What does this say about coherent BPSK versus noncoherent DPSK?
Deliverable question 7
If your results look like the BER curves above, say so. If your results do not look like the BER curve above, explain where your experiment went wrong and what you believe the cause of error to be.
Review the section deliverables before moving on.
UVic ECE Communications Labs
Lab manuals for ECE 350 and 450